
Issue #198:
BTC DIRECTION NOW DETERMINED BY ETF FLOWS
Bitcoin Caught Between Structural Strength and Weakening Demand
Bitcoin’s recent price action reflects a market caught between structural resilience and deteriorating demand. A failed breakout above the $72,000 range highs, followed by a sharp retracement, highlights that recent upside moves have been driven more by short liquidations than sustained spot buying. As price returns toward the monthly open, the absence of follow-through demand has reinforced a range-bound and fragile structure .
Institutional flows have undergone a clear regime shift. After a strong accumulation phase in early March, ETF flows have turned decisively negative, culminating in some of the largest single-day outflows from IBIT. This reversal signals active de-risking by institutional participants rather than passive rotation, removing a key pillar of support for price.
On-chain and structural metrics confirm this deterioration. The Bitfinex Absorption-to-Emissions Ratio (AER) has collapsed from a speculative peak above 5x to just 1.3x, indicating that demand is now only marginally exceeding new supply. The market has transitioned from aggressive accumulation to a fragile equilibrium, where even modest outflows could tip Bitcoin into a supply-driven downside regime.
Notably, Bitcoin has declined during a period of heightened macro stress, a dynamic that appears, at first glance, to challenge its store-of-value thesis. Rather than acting as a hedge against inflation and systemic risk, Bitcoin has remained correlated with broader risk assets and has participated in ongoing institutional de-risking. This behaviour reflects the dominance of liquidity conditions in the current regime, where rising real yields and tighter financial conditions are driving capital allocation decisions.

However, this does not invalidate Bitcoin’s structural role. Its position as a non-sovereign, supply-constrained asset remains intact, but this thesis is expected to play out over longer time horizons measured in quarters, rather than in immediate market reactions.
The current market environment has seen a sharp macro deterioration paired with accelerating structural change across financial markets. Rising energy prices and geopolitical escalation have weakened consumer confidence, with US Consumer Sentiment falling to 53.3, while inflation expectations rise and growth risks build. At the same time, the labour market remains resilient but is gradually softening, reinforcing a “higher-for-longer” policy stance as central banks balance inflation against slowing demand .
This macro backdrop is feeding directly into asset allocation shifts. Gold, traditionally a safe haven, has weakened under the pressure of rising yields and a stronger US dollar, as investors prioritise liquidity over static hedges. In parallel, digital assets are gaining structural traction, with institutional adoption accelerating, particularly in stablecoins, payments infrastructure, and tokenisation, signalling a longer-term transformation in how capital is stored and transferred.
Corporate behaviour is evolving alongside this shift. MARA’s $1.1 billion Bitcoin liquidation to reduce debt marks a clear departure from passive “HODL” strategies toward active treasury management, where Bitcoin is treated as a liquid balance sheet asset rather than a pure store of value. Simultaneously, major institutions like the NYSE are pushing toward 24/7 tokenised securities markets, pointing to a future where traditional financial infrastructure is rebuilt on blockchain rails. Regulatory positioning is also adapting.
In effect, Bitcoin is caught between two regimes: a structurally bullish transformation of the financial system, and a tactically bearish macro environment. The resolution of this tension will define the next major move.
Market Signals
Bitcoin Retraces to Monthly Open as Geopolitical Turmoil Continues
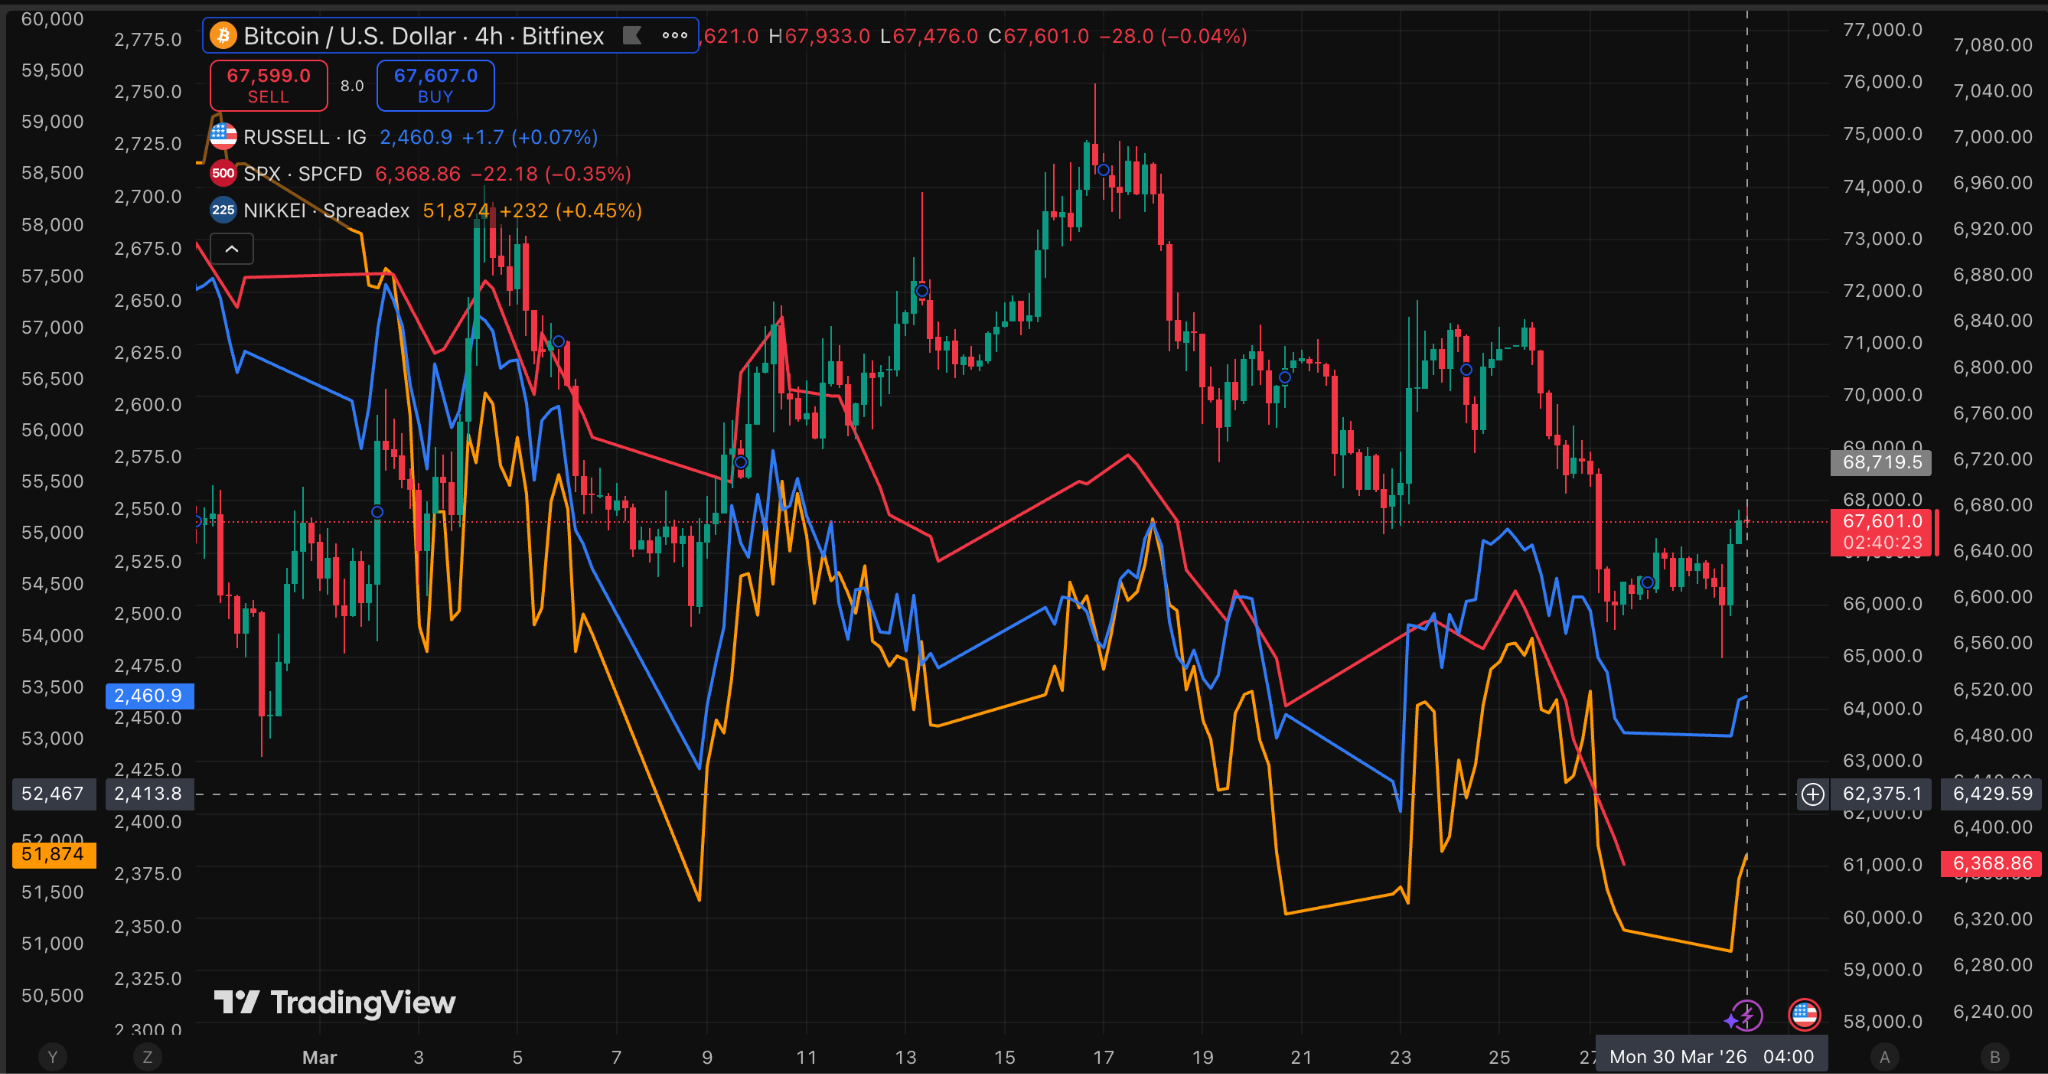
Bitcoin had started March well, exhibiting relative resilience, compared to equities, energy, and commodity markets, despite ongoing geopolitical tensions. Since early March, price has formed a sequence of higher highs and higher lows, establishing a constructive short-term trend within a now multi-month $64,000–$72,000 range.
However, recent weeks have seen considerable volatility (see Figure 1 below): an initial false breakout above the range highs, a subsequent retest of the March monthly open of $67,035, and then a rally back to range highs, around the $72,000 mark, only to drop again with the asset trading now near the monthly open. This suggests that leveraged positions which entered late in the rally were taken out in the form of liquidations, or were stopped out.
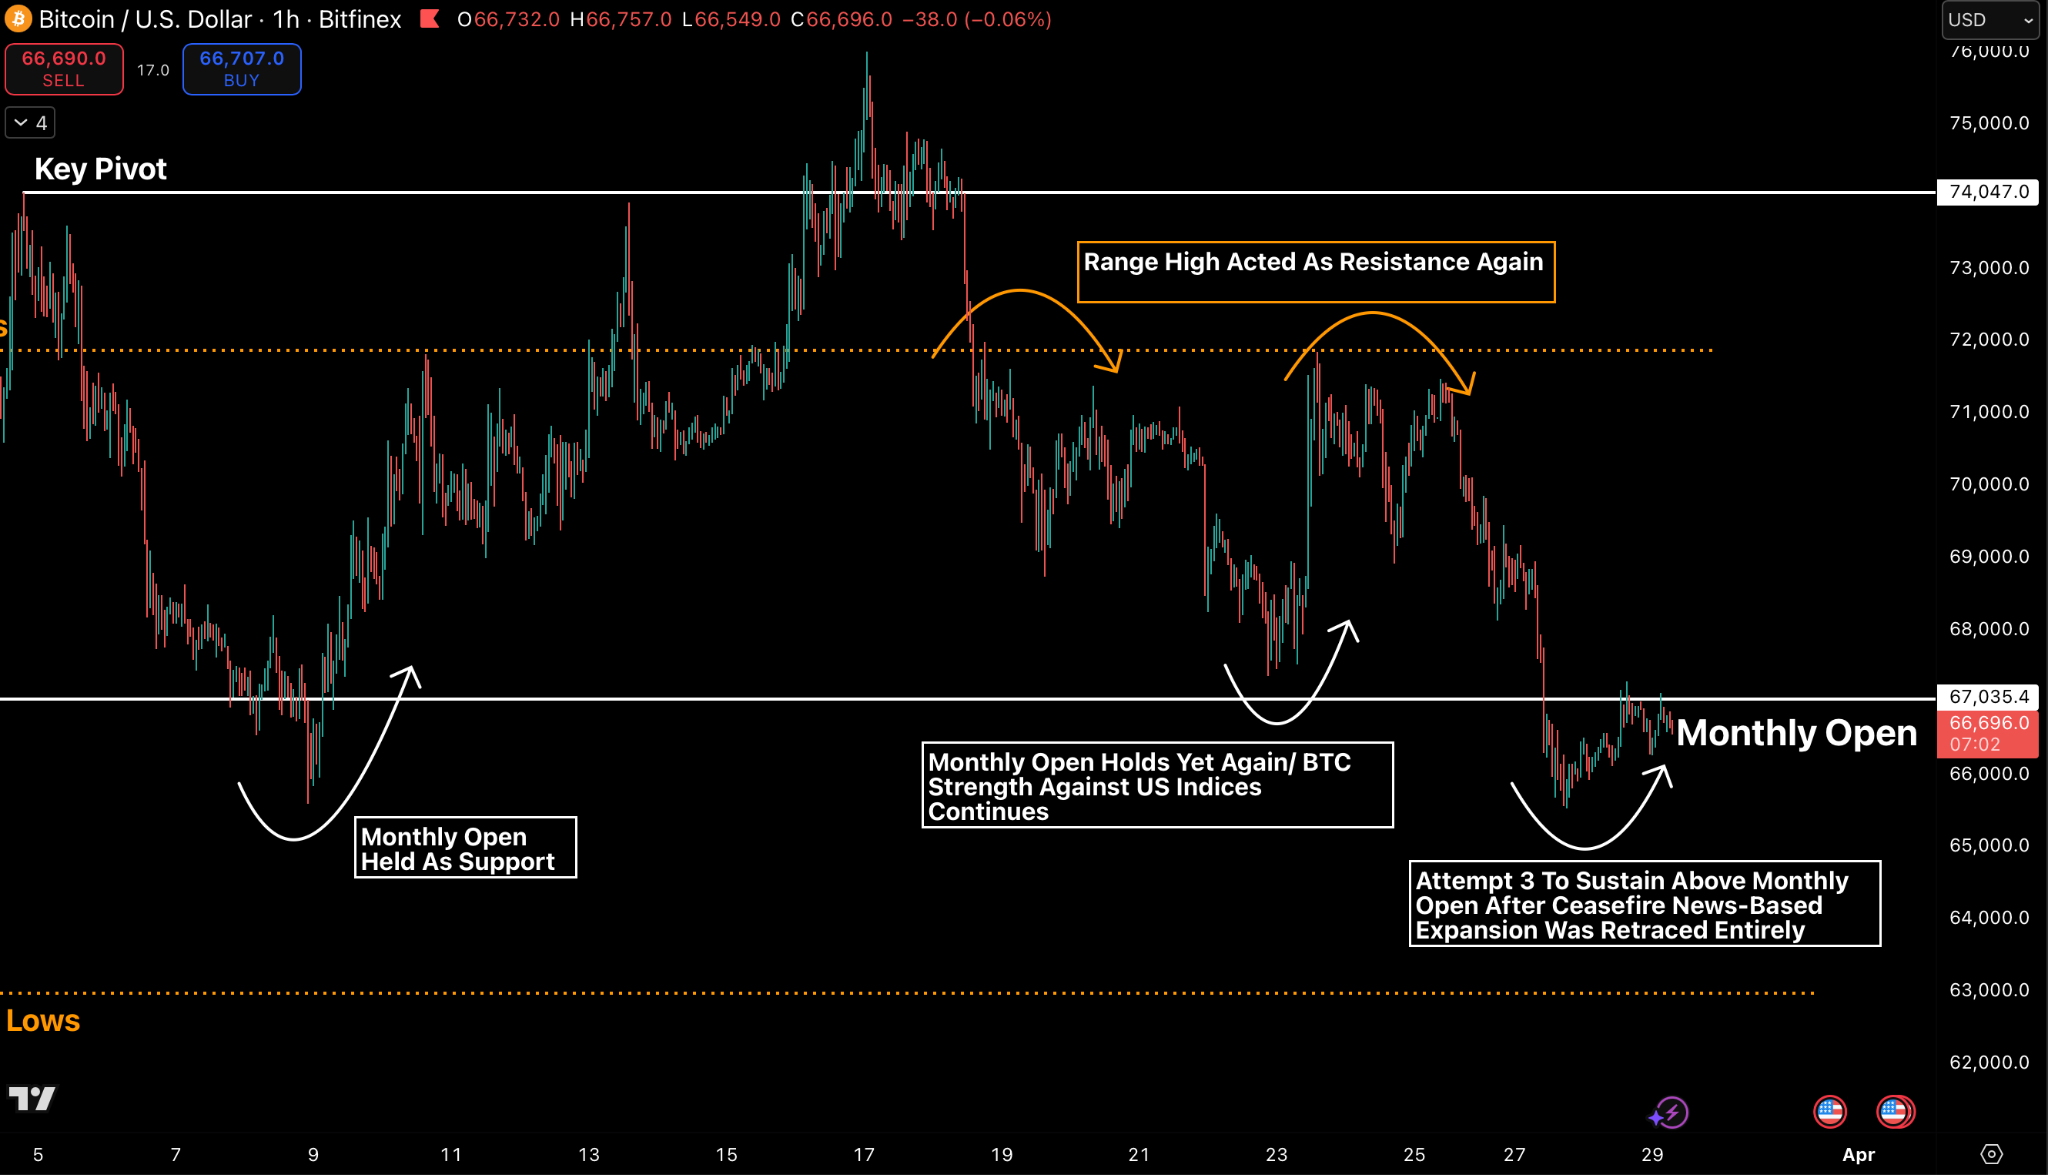
Bitcoin’s recent price action, though range-bound and struggling for a directional shift, reveals a critical underlying structural narrative. After opening the week at $67,870, hitting a peak of $71,843 before suffering a sharp, 8.8 percent decline to $65,525, it indicates that despite a currently a a supportive macro backdrop, there is a significant component of leveraged unwinding in the market, and a discernible lack of robust, sustained spot demand whenever price reaches the upper bound of the current trading range.
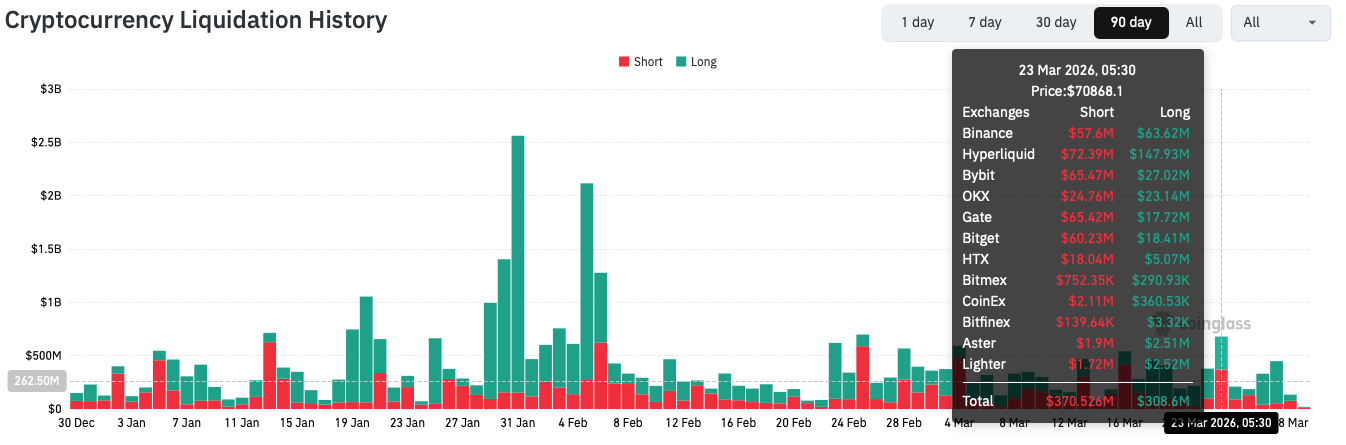
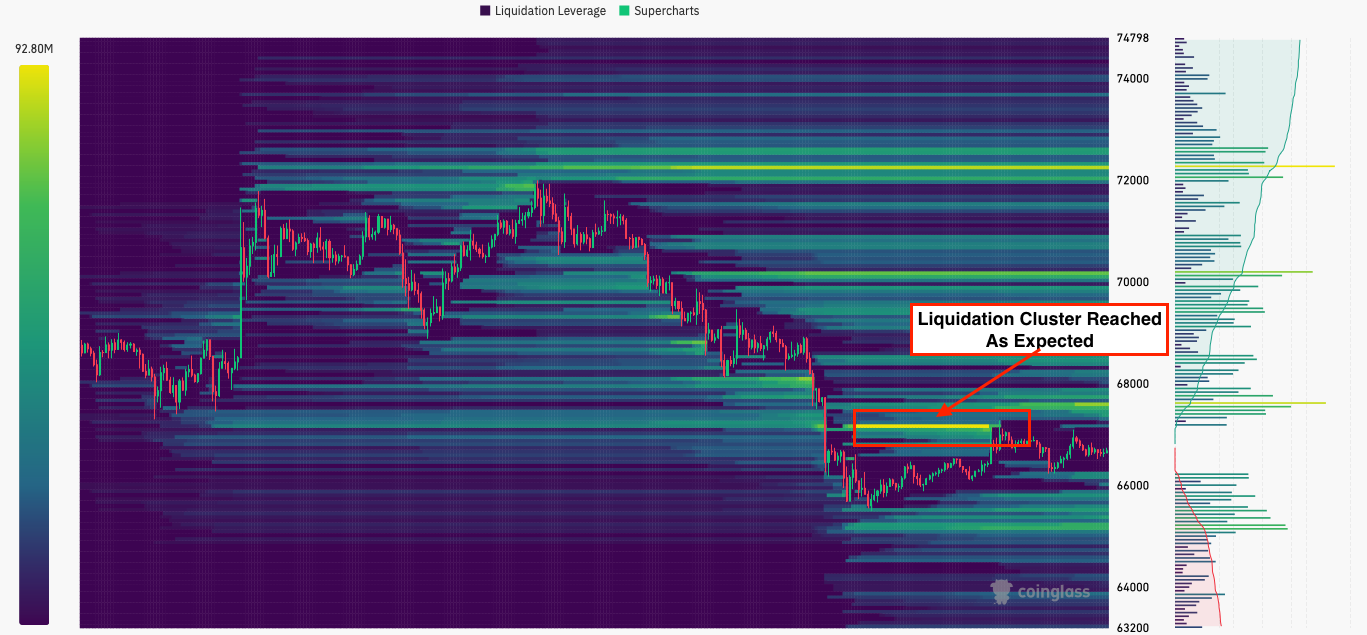
The initial upward momentum on March 23rd was catalyzed by over $370 million in short liquidations, the highest in over a month. This also led to a brief incursion into the liquidation cluster near range highs at $72,000.
The upward move was initially triggered by signals of progress in peace negotiations and a potential five-day ceasefire between Iran and the US. Markets briefly priced in a “risk-on” premium on the expectation of a positive resolution following the US intent for dialogue and a subsequent five-day peace announcement. However, Iran’s outright rejection of any ceasefire, coupled with contradictory public messaging from US leadership, completely invalidated this catalyst. Price subsequently broke below the support established during the peace announcement, executing a textbook ‘failed-catalyst’ re-pricing.
With 20 percent of Qatar’s LNG capacity now offline and the Strait of Hormuz effectively closed, the market has recalibrated its outlook, pricing in a prolonged conflict horizon potentially extending through 2027. Geopolitical risk has transitioned from an acute shock to a structural regime. Notably, Bitcoin has failed to manifest the store-of-value premium that this type of escalating systemic risk would theoretically generate.
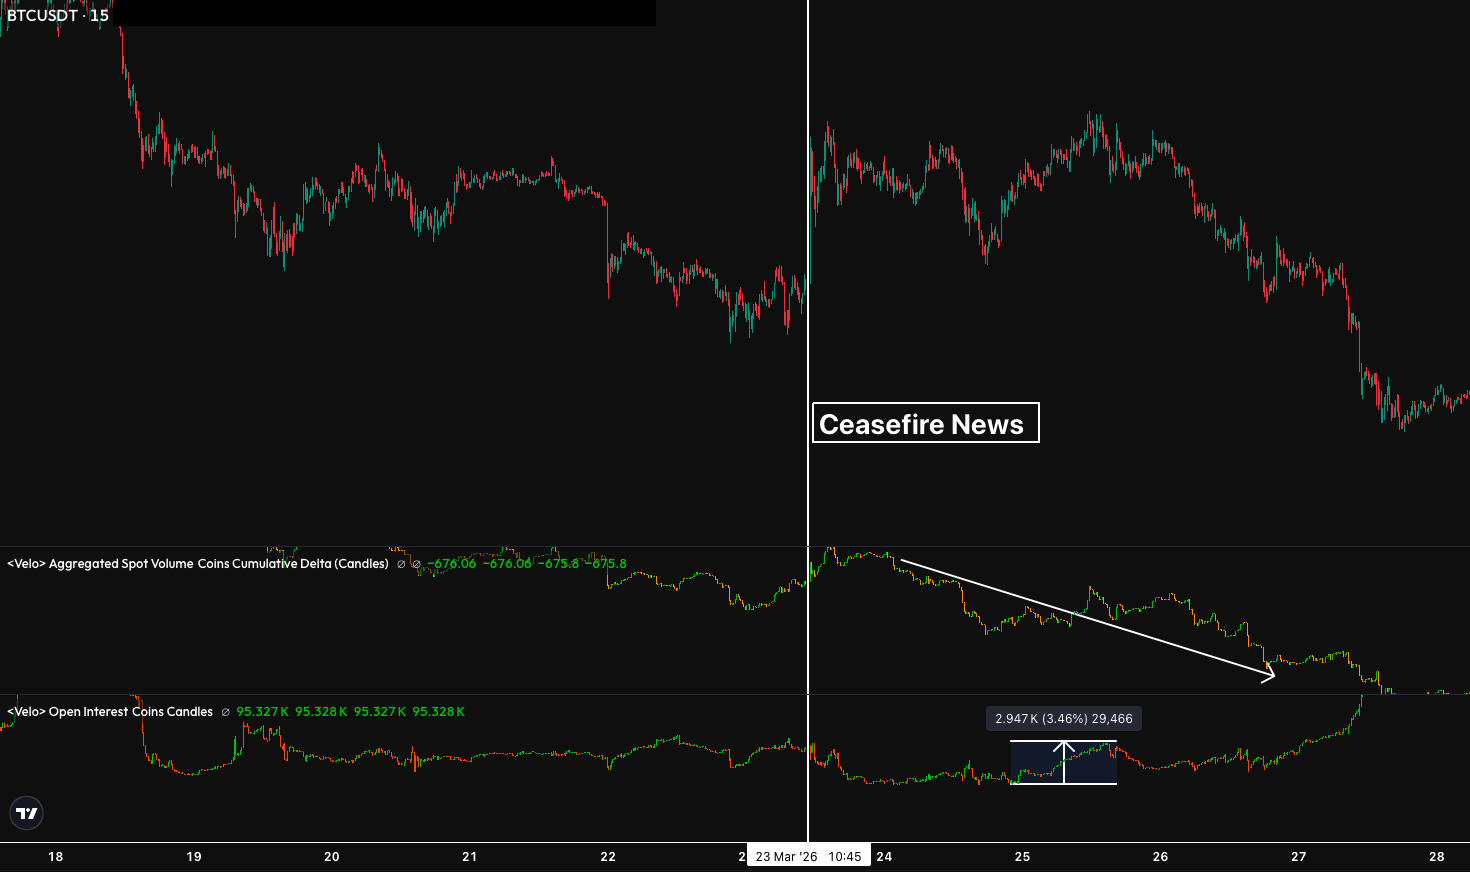
Any aggressive buying of spot pairs has ceased or even reversed once BTC trades above $68-72,000 indicating that buying interest evaporates once price trades at a premium (upper half of the current range). Most of the move higher on March 23 was catalysed by short liquidations, leaving open interest more than 55 percent off its ATH. What is interesting is that after back and forth contradictory statements from both Iranian and US administrations, new perpetual long positions chased the price opening above $70,000 on March 24, while spot takers actually distributed supply at those prices resulting in a full retracement of the move by the end of the week.
The weekly ETF data provides the most distinct behavioural signal. Following a robust, five-session streak of net positive flows between March 10th and 17th, which generated a cumulative influx of approximately $994 million, the ETF complex experienced a sharp reversal. The week spanning March 23rd to 27th concluded with a net outflow of $296.3 million.
| Period | Net flow (USD) | Behavioural signal |
|---|---|---|
| 10–17 Mar | +$994.7m | Sustained inflows: ETF bid dominant, consistent accumulation |
| 18–20 Mar | –$305.7m | Abrupt reversal: three consecutive outflow days mark regime shift |
| 23 Mar | +$167.2m | One-session recovery: bid present but short-lived |
| 24–25 Mar | –$66.7m | Fading demand: inflow bounce rejected, net negative over two days |
| 26–27 Mar | –$396.8m | Accelerating outflows: IBIT alone contributes –$201.5m on 27 Mar |
Figure 5. Bitcoin ETF Net Flow
Crucially, the daily flow trajectory gives more insight than the weekly aggregate: flows systematically trended more negative as the week progressed. The final two trading days were particularly severe, recording an outflow of –$171.3 million on March 26, followed by –$225.5 million on March 27. This marked the largest single-day outflow of the observed period. Notably, BlackRock’s IBIT alone registered a $201.5 million withdrawal on March 27. Such a significant single-day withdrawal amidst a period of acute geopolitical shock, indicates a deliberate institutional position reduction, rather than minor retail redemption pressure.
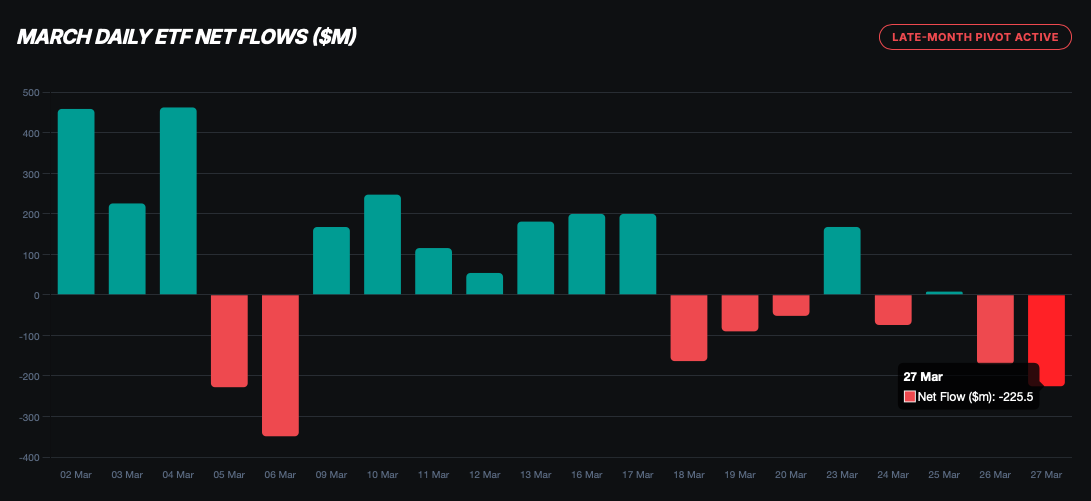
The prior week (18–20 March) had already recorded three consecutive outflow days totalling $305.7 million. The ETF bid has now been absent or net negative for the majority of two consecutive weeks, a meaningful regime change from the accumulation phase that characterised early March.
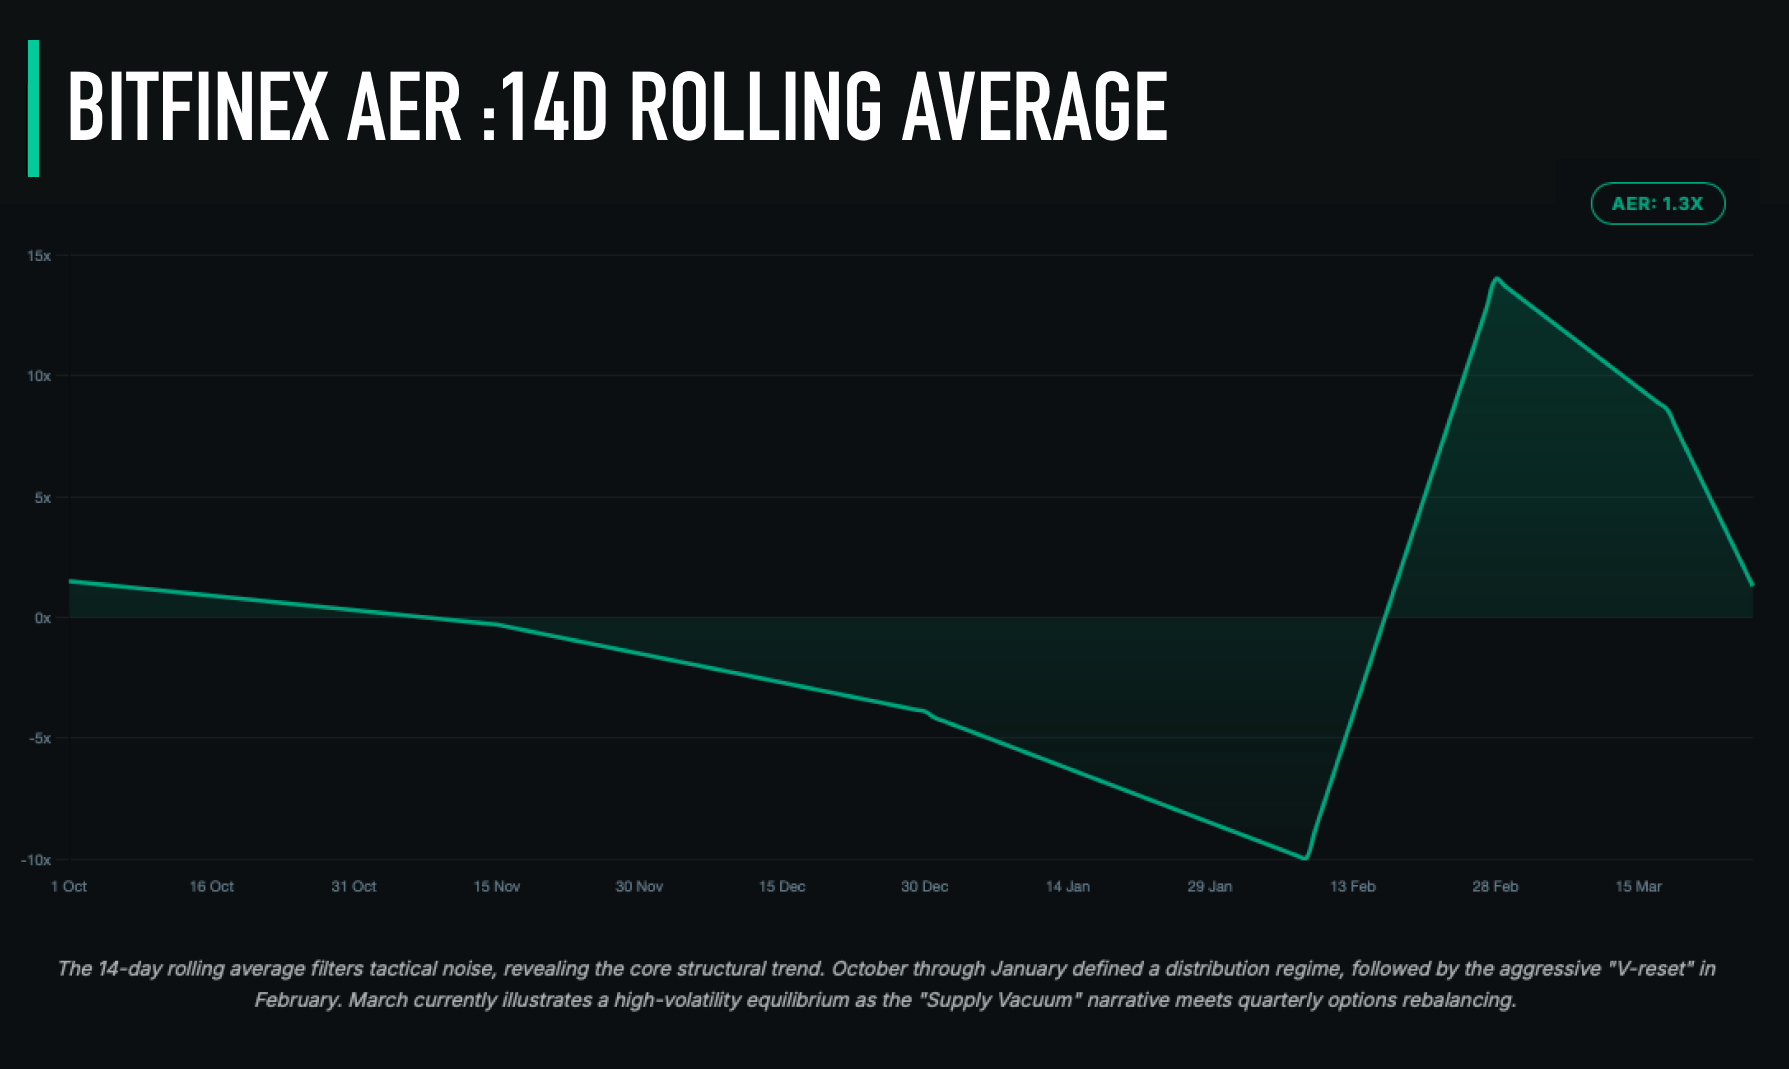
The 14-day rolling average of the Bitfinex Absorption-to-Emission Ratio (AER) , which measures institutional ETF and direct absorption demand of BTC, relative to daily miner issuance, currently stands at 1.3x. This marks a >75 percent collapse from the late-February peak of approximately 5.3x, a shift that has occurred in under six weeks and signals a rapid deterioration in demand intensity.
The AER framework can be segmented into three distinct regimes:
~5x (Speculative Accumulation):
This level, observed in late February 2026, reflected an overheated demand environment where institutional and spot absorption vastly exceeded new supply. It coincided with strong price expansion and momentum-driven inflows.
1x–3x (Passive Absorption / Erosion):
The current reading of 1.3x places the market firmly within this band. Here, demand still marginally exceeds miner issuance, but only just. This regime is characterised by fragile equilibrium, where even modest increases in sell pressure or ETF outflows can destabilise the balance.
<1x (Supply Overhang / Vacuum Invalidation):
A sustained move below 1x for three or more consecutive days would formally invalidate the Supply Vacuum thesis for this cycle. In such a scenario, newly issued supply would exceed absorption, introducing structural downside pressure.
At present, the market remains in passive absorption territory, but the margin of safety is extremely thin. With AER at 1.3x, only one or two meaningful outflow sessions could push the ratio below the critical 1x threshold.
The most important signal is not just the level, but the velocity of the decline. A transition from a speculative peak (5.3x) to near-invalidation levels (1.3x) within six weeks represents a regime shift in demand quality. It reflects a move away from aggressive accumulation toward a fragile, reactive market structure where sustaining price requires continuous, rather than expanding, inflows.
In this context, monitoring AER alongside ETF flows becomes critical. A stabilisation or rebound in absorption would support price consolidation, whereas a break below 1x would likely coincide with renewed downside pressure for BTC and a likely break under our range lows, as structural demand fails to keep pace with ongoing supply. However, that’s not our base case, and it will take a scenario where the situation for risk assets is materially worse, such as a stagflation scenario, with the Fed being forced to hike and liquidity getting even thinner.
As Macro Stress Persists and Intensifies, Why Is Bitcoin Falling?
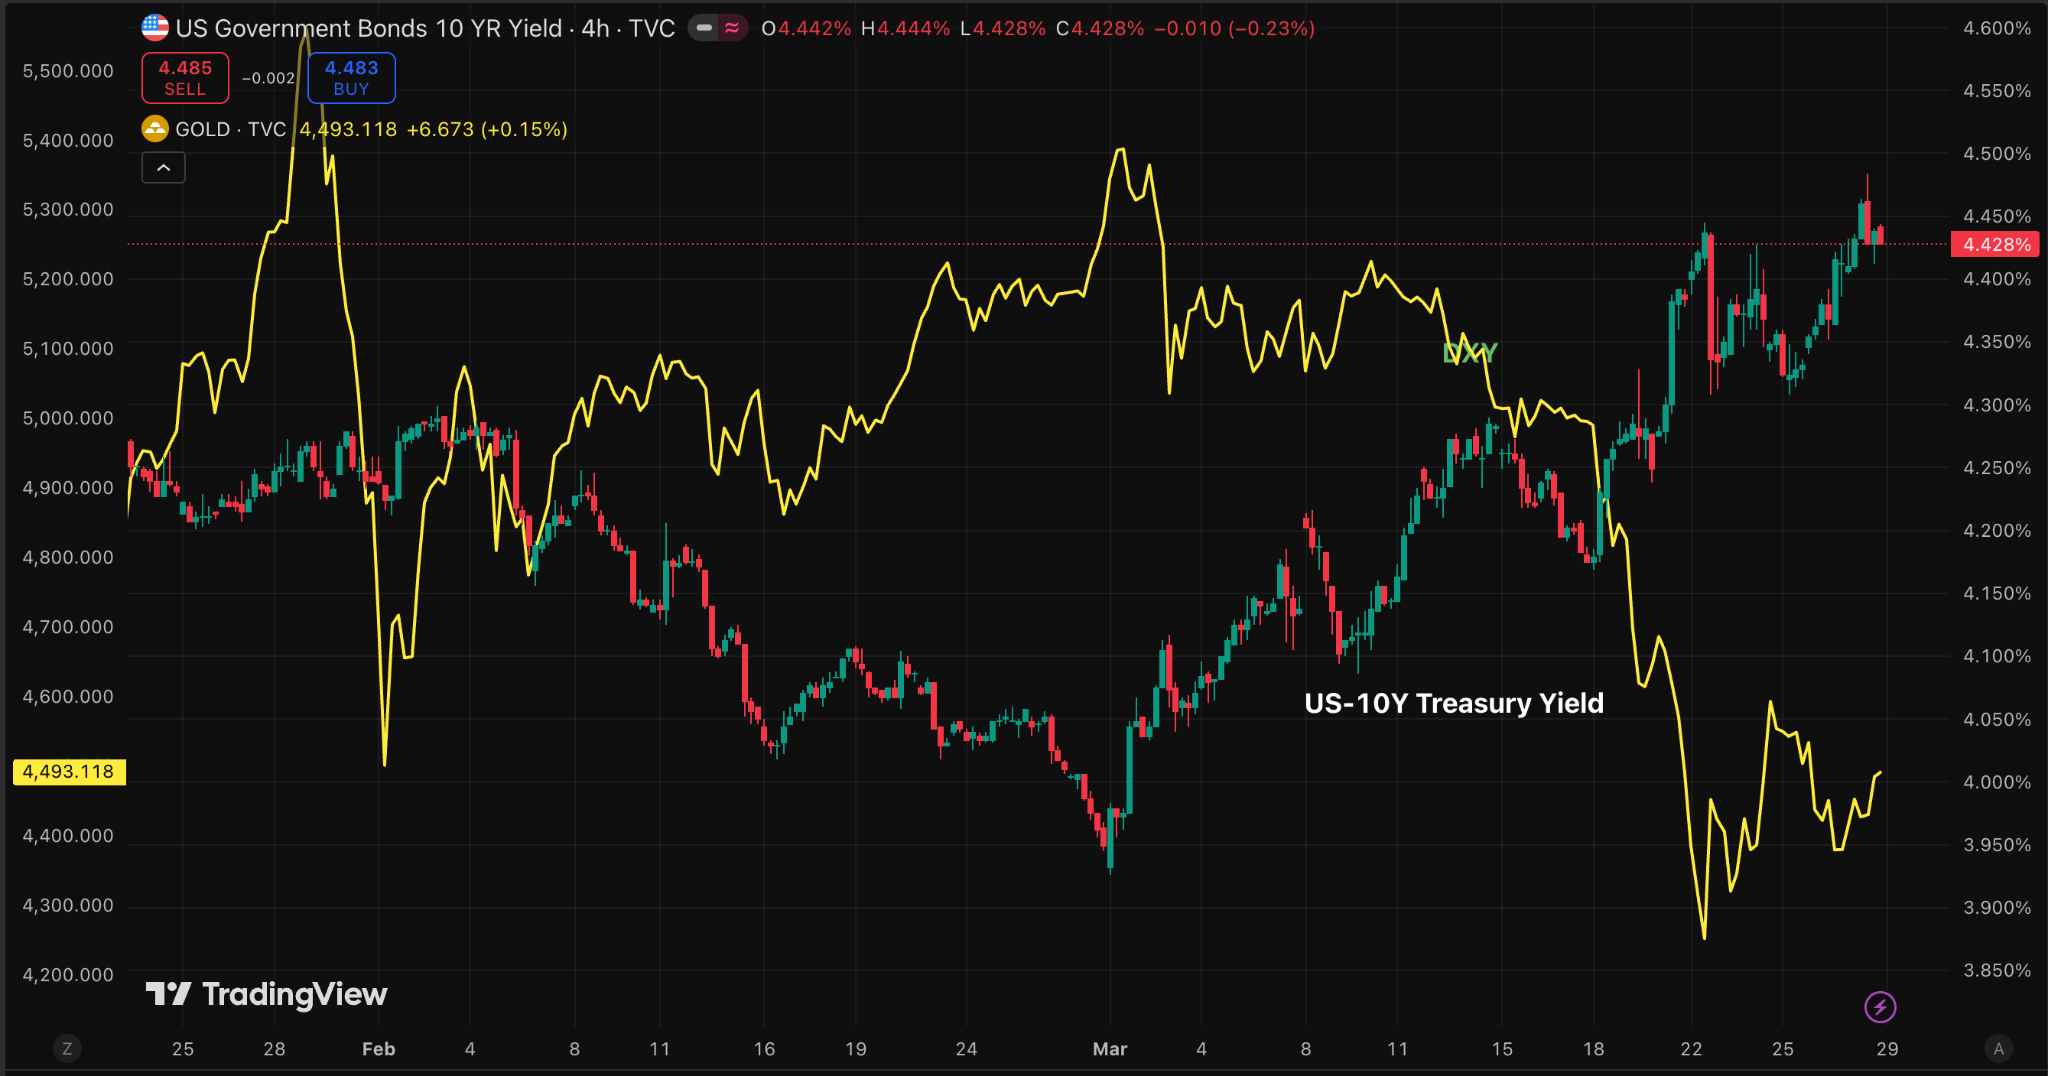
The global macro regime has shifted over the past two weeks, from rate-cut anticipation to the possibility of stagflation, as the Iran conflict generates simultaneous shocks across energy, bond, and currency markets that no single central bank is positioned to cleanly resolve. Global bond markets shed $2.5 trillion in market value in March, the largest monthly decline since the Federal Reserve’s 2022 tightening cycle. As a result, the 10-year yield has risen to its highest value since July 2025, when the current cutting cycle began last year.
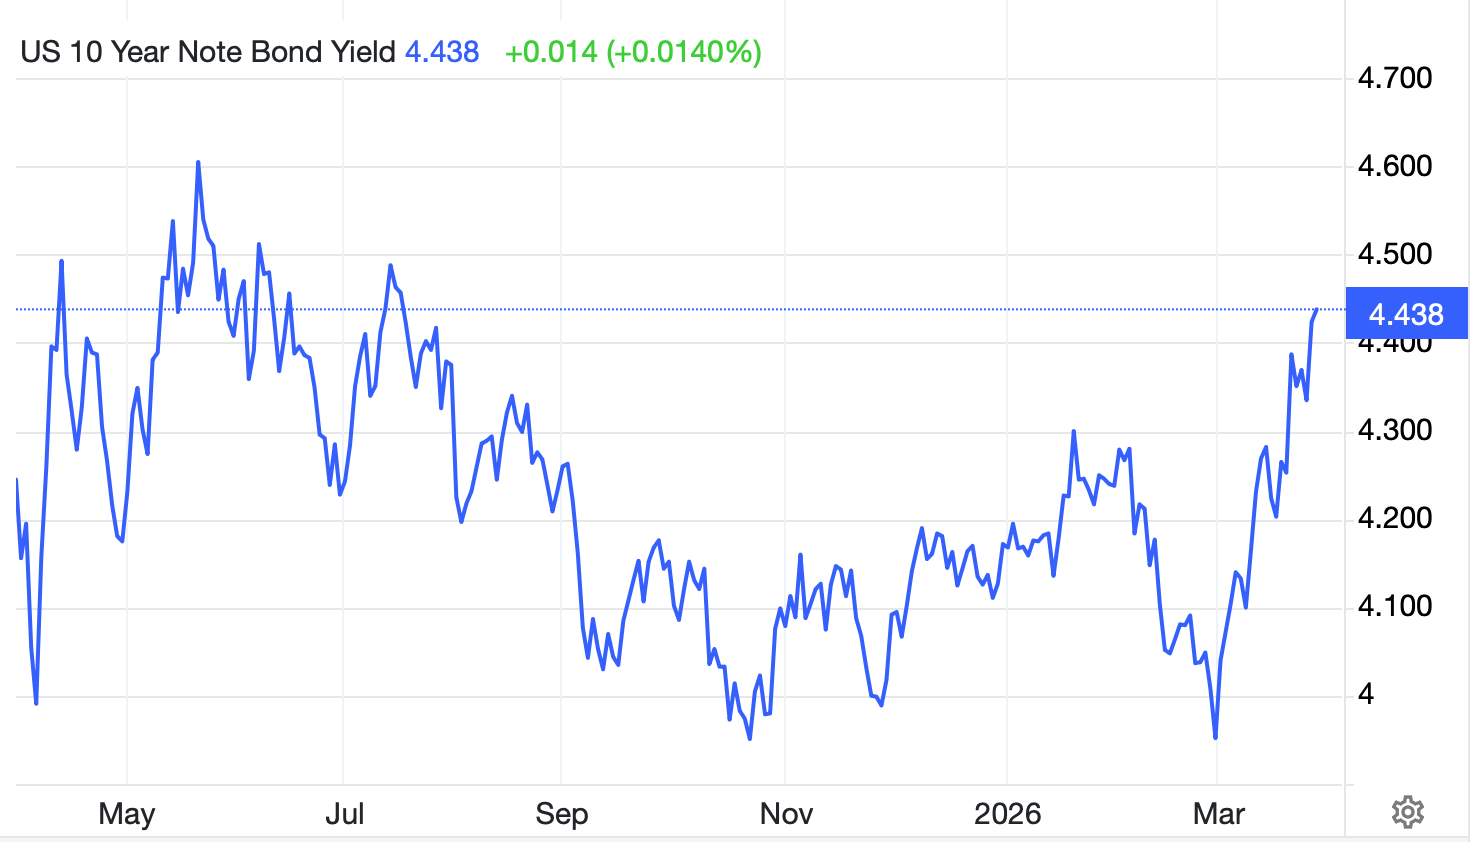
This has reduced the total value of the government and corporate debt market to $74.4 trillion. The catalyst was not a shift in growth expectations but a repricing of inflation: with 20 percent of Qatar’s LNG capacity offline and the Strait of Hormuz effectively closed, energy price pressures are feeding directly into headline inflation readings.
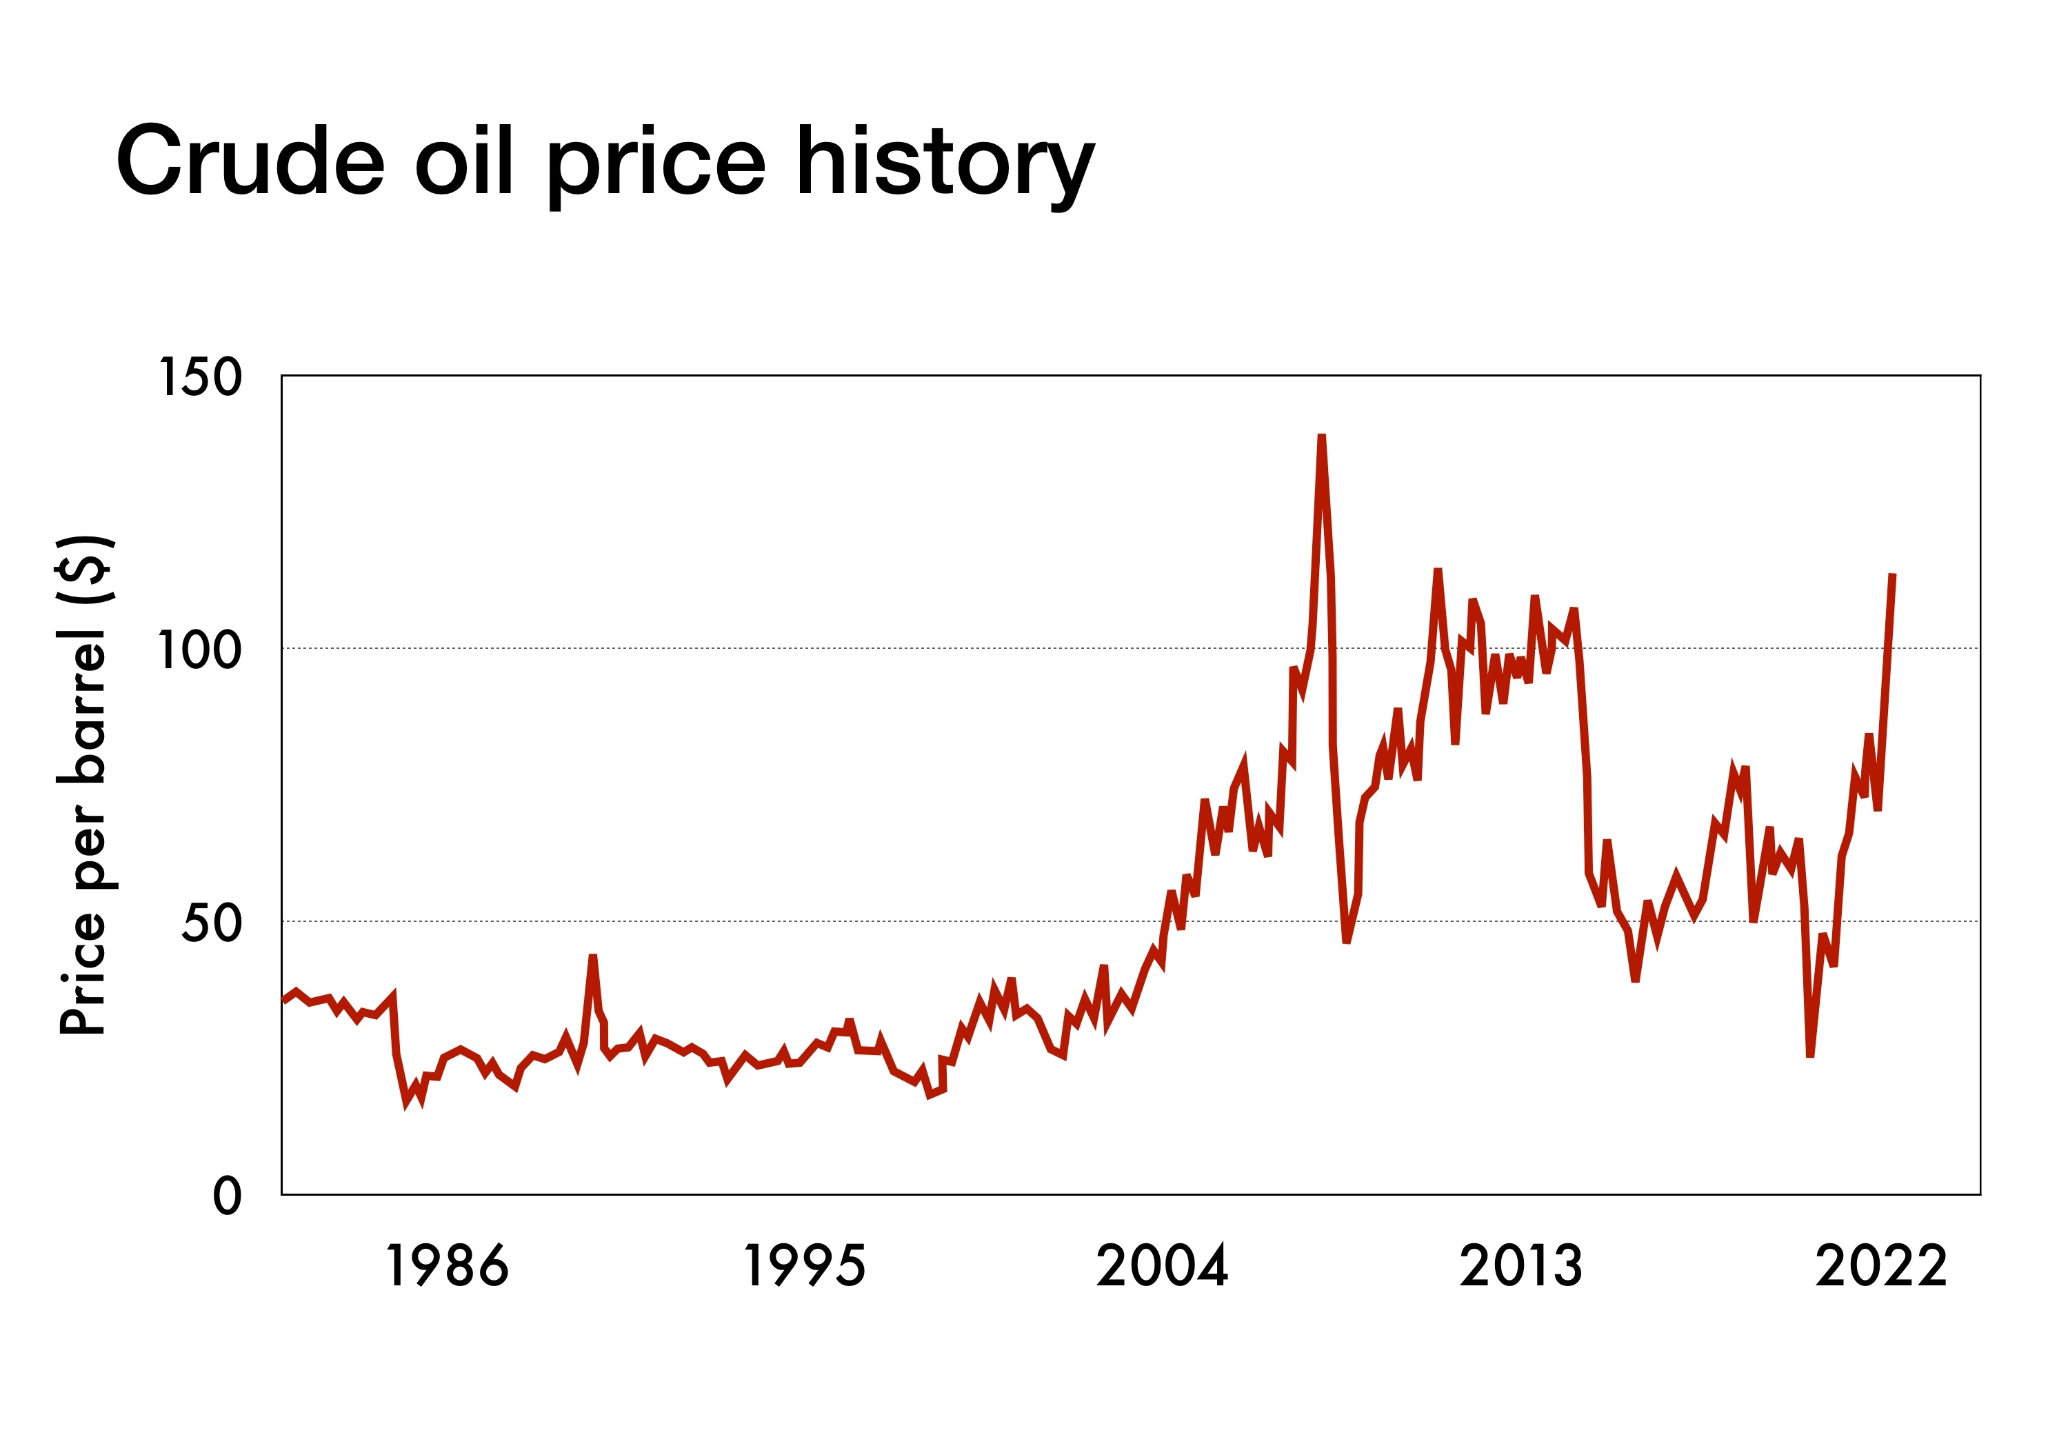
Oil’s impact on headline CPI is not linear, but it is rapid; markets are not waiting for the next inflation print to confirm the direction of travel.
The Federal Reserve now confronts a structurally untenable position. Fed Funds futures are pricing a nearly 50 percent probability of a rate hike by October 2026, a complete inversion of the successive rate-cut trajectory the market held as consensus entering this year.
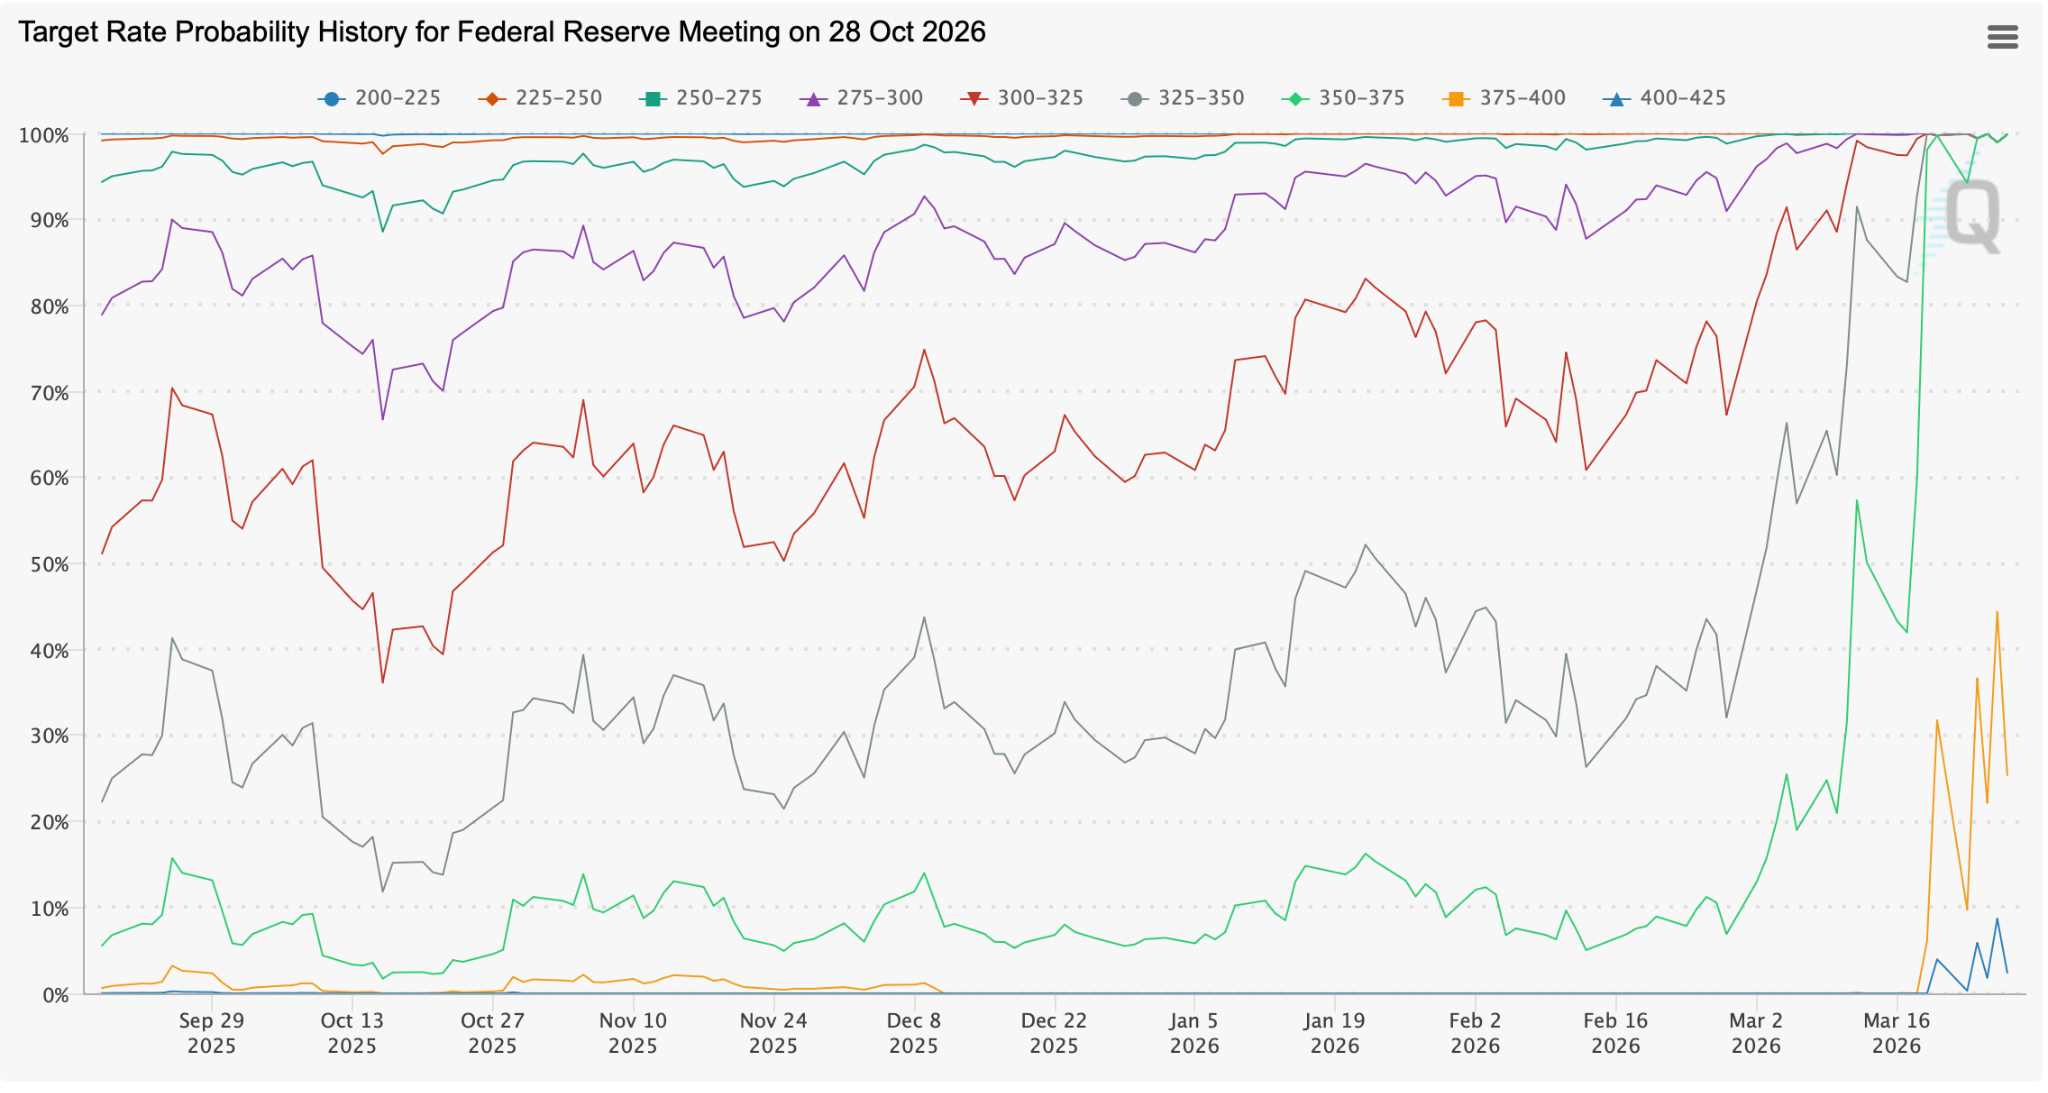
(Source: CME FedWatch Tool)
Federal Reserve Chair Jerome Powell acknowledged publicly that the conflict will push inflation higher. The two-year Treasury yield, the most rate-sensitive instrument on the curve, is approaching a 12-month high. The short end of the curve is telling a clear story: the market no longer believes the Fed can cut, and is beginning to price the alternative.
For Bitcoin, the macro signal is bifurcated. In the near term, rate hike probability compresses the liquidity conditions that have historically supported non-yielding, high-beta assets. The 2022 parallel is instructive: the Fed’s last major tightening cycle coincided with Bitcoin declining from $69,000 to $15,500 over 12 months (although admittedly the FTX collapse was also a significant contributor). The mechanism is not abstract; when real yields rise and risk-free alternatives become attractive, portfolio capital withdraws from assets without intrinsic yield.
However, the same macro regime shift strengthens the structural case for Bitcoin as the only non-sovereign, algorithmically-constrained store of value in a world where the supposedly safe foundation of the global financial system, government bonds, just lost $2.5 trillion in weeks. That structural thesis is valid, but it resolves over quarters, not days.
The equity picture reinforces the short-term headwind. The S&P 500 and the Nikkei have retreated to significant lows, and Asian markets are experiencing their heaviest institutional outflows since the 2008 financial crisis. Bitcoin is not decoupling from this de-grossing. It is participating in it.
Bitcoin fell almost 9 percent from the weekly highs to lows during precisely the period when the digital gold thesis should have been most active: as bonds sold off, oil surged, and sovereign debt lost trillions. The correlation with equities remained intact. Bitcoin did not decouple. It participated in the institutional de-grossing alongside the S&P 500 and Nikkei.
The key data point that underlines this consensus: on 27 March, the day the bond market narrative was most acute, IBIT recorded its largest single-day outflow of the recent period at $201.5 million.
Institutions with access to both Bitcoin and the “inflation hedge” narrative chose to reduce their exposure to Bitcoin, not increase it. That is the most direct available signal of how sophisticated market participants are actually behaving, as distinct from how they are theoretically positioned to benefit.
The structural thesis that Bitcoin’s non-sovereign, censorship-resistant design makes it the optimal hard asset in a world of sovereign debt crises remains compelling over a 12–24 month horizon. It is not the trade of this week.
The question for serious market participants: where does Bitcoin find a floor in an environment where the ETF bid is withdrawing, and derivatives leverage has unwound significantly, and macro liquidity conditions are tightening?
General Macro Update
Consumer Confidence Weakens as Energy Shock Raises Inflation Risks but Labour Market Remains Stable
US consumer sentiment declined in March as rising energy prices and geopolitical tensions weighed on economic expectations, even as labour market data suggests underlying resilience. However, policy responses to the energy shock could amplify inflationary pressures, reinforcing the Federal Reserve’s cautious stance on interest rates
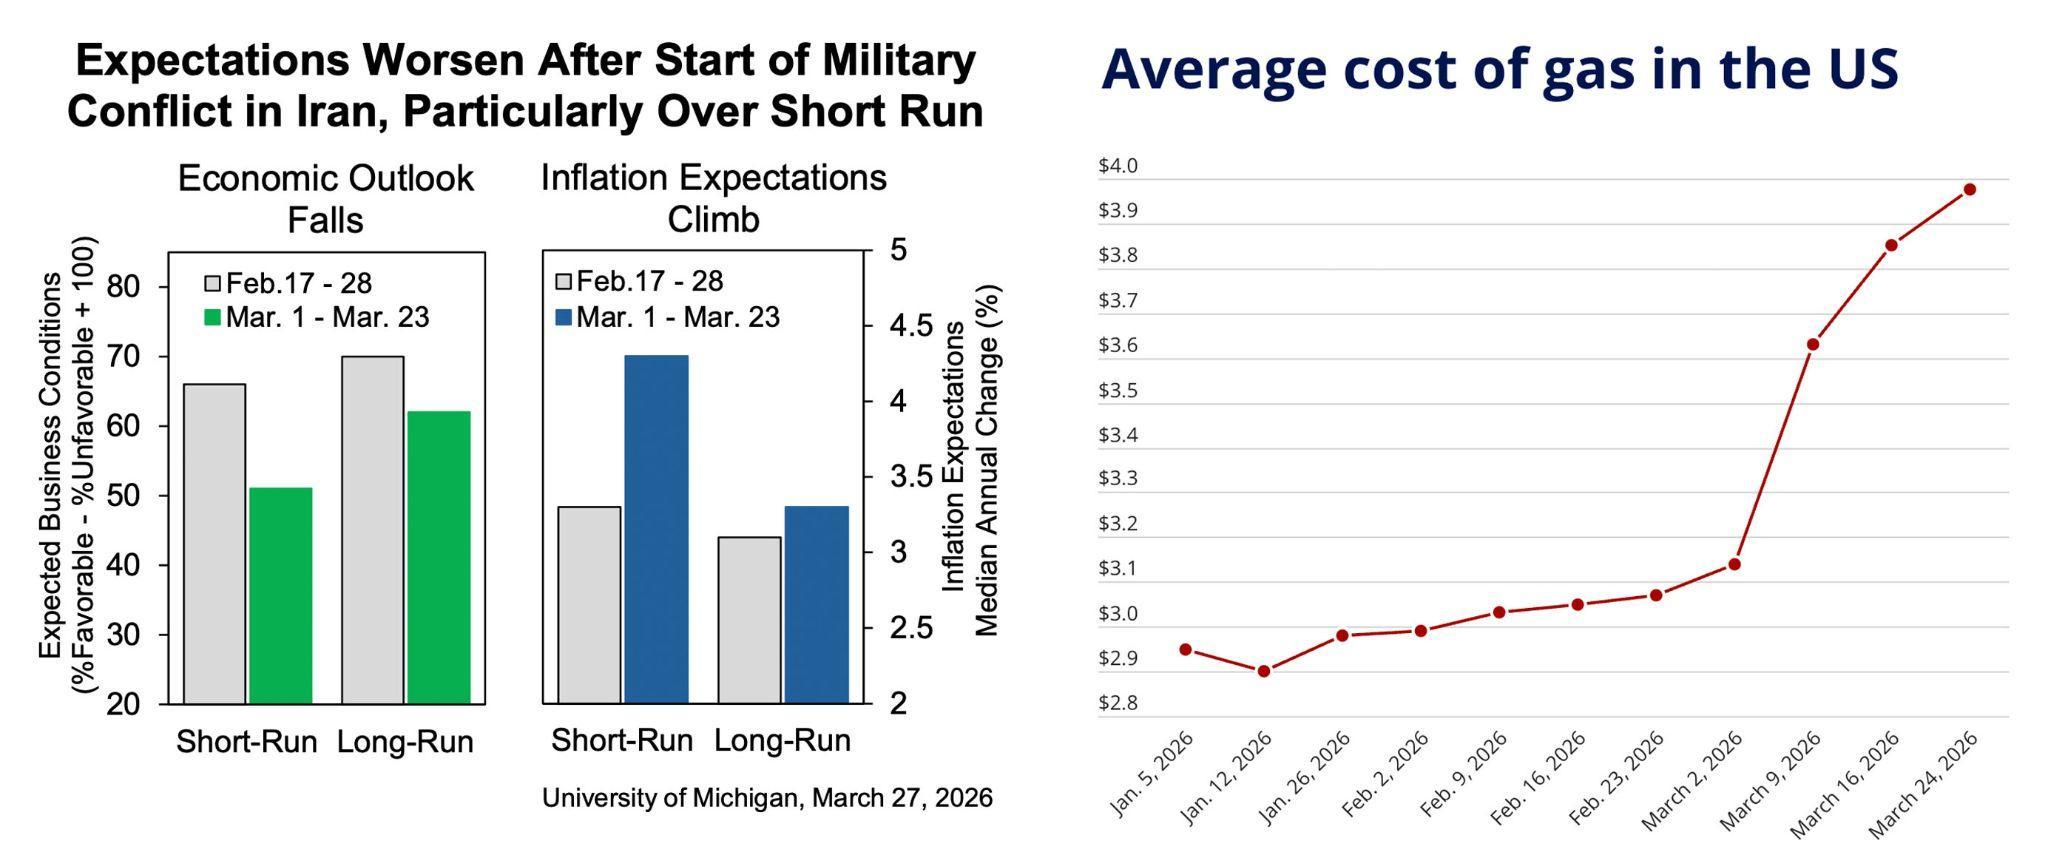
Average Cost of Gas in the US
The Consumer Sentiment Index released by the University of Michigan showed a sharper-than-expected drop to 53.3 in March, reflecting deteriorating confidence across income groups and investor cohorts. The chart above highlights how expectations worsened following the escalation of conflict in Iran, with short-term economic outlook declining more sharply than long-term expectations. At the same time, inflation expectations rose notably, particularly in the short run, indicating that households are increasingly concerned about near-term price pressures.
This divergence is important. In simple terms, consumers appear to believe that current conditions will worsen in the near term due to higher energy costs, but are less certain that these pressures will persist over the longer horizon. Rising gasoline prices reduce disposable income, meaning households must allocate more spending towards essentials, leaving less available for discretionary consumption. Combined with weaker equity markets, this dynamic raises the risk of slower economic growth if sustained.
In contrast, the Initial Jobless Claims Report published by the US Department of Labor indicates that the labour market remains relatively stable, with claims in the week ending March 21, rising modestly by 5,000 to 210,000 and continuing claims falling to their lowest level in nearly two years. This reflects what economists describe as a “low-hire, low-fire” environment, where companies are cautious about both hiring and layoffs. However, underlying momentum is weakening, with job creation slowing and forecasts pointing to a gradual rise in unemployment to around 4.5-4.6 percent. The energy shock is expected to weigh further on employment, as higher input costs reduce business margins and hiring appetite.
This dynamic connects directly to broader policy debates on how to respond to rising energy prices. Measures such as fuel subsidies or restricting energy exports may appear to offer short-term relief, but they risk worsening inflation. Subsidies, for example, increase consumers’ effective purchasing power, which can lead to stronger demand and push prices higher. Similarly, limiting exports would tighten global supply, raising energy costs both domestically and internationally. As a result, such interventions could unintentionally intensify inflationary pressures that are already eroding consumer confidence, reinforcing the delicate balance between resilient labour conditions and weakening sentiment.
Gold Weakens as War Intensifies While Digital Assets Gain Strategic Ground
Gold prices declined as stronger inflation pressures and rising interest rate expectations reduced its appeal, even as geopolitical tensions in the Middle East continued to escalate. At the same time, financial institutions are accelerating their shift towards digital assets, signalling a structural change in how value is stored and transferred across the global economy.
Why Is Gold Down and Oil Up?
Recent market data shows that gold is facing pressure from multiple fronts, combining macroeconomic forces and geopolitical uncertainty into a complex outlook.
Gold prices fell sharply following market reactions to higher oil prices and a firmer US dollar, both of which reinforced expectations that the Federal Reserve may keep interest rates elevated for longer. In simple terms, when interest rates rise, investors can earn better returns from assets like bonds, making non-yielding assets such as gold less attractive to hold. At the same time, data from the US Department of Labor showed a slight increase in unemployment claims, indicating that the labour market remains stable and giving the Fed room to maintain its current policy stance.
The ongoing conflict in the Middle East has however expanded beyond its initial scope, now affecting multiple regions across the region and key maritime routes such as the Red Sea and the Strait of Hormuz. This is significant because the Strait alone handles roughly one-fifth of global oil supply. Any disruption here directly impacts energy prices worldwide.
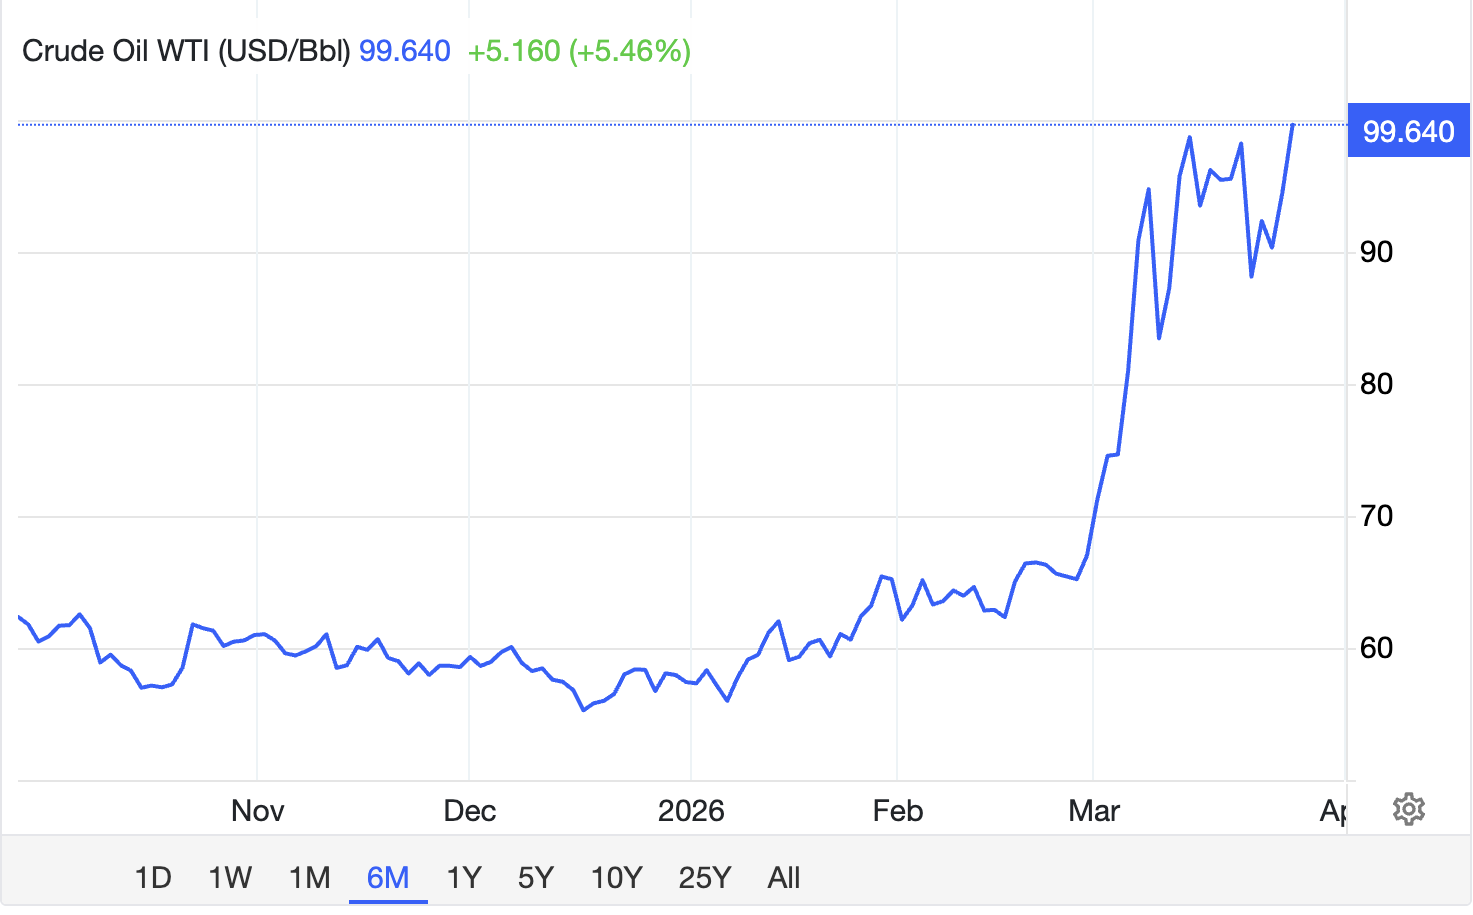
As a result, oil prices have risen, feeding into broader inflation concerns. Higher energy costs raise prices across the economy, which in turn pushes inflation higher. This creates a feedback loop: higher inflation leads to higher interest rates, which in turn weigh on assets like gold. For consumers, this translates into rising fuel costs and borrowing expenses, as seen in higher mortgage rates and declining housing demand.
Financial markets are already reflecting these pressures. Rising Treasury yields have increased borrowing costs across sectors, while equity markets have weakened, reducing household wealth and potentially dampening consumer spending. These combined effects point to a more restrictive economic environment if the conflict persists.
Despite gold traditionally being viewed as a safe-haven asset, recent market behaviour suggests a shift in investor preference. In periods of acute uncertainty, investors are prioritising liquidity, meaning they prefer to hold cash or cash-like instruments rather than assets like gold. This helps explain why gold prices have declined even amid rising geopolitical risks, marking a divergence from historical patterns.
Why Are Digital Assets Benefitting?
In parallel with these developments, the financial system is undergoing a structural transformation driven by digital assets. A recent survey conducted by Ripple highlights that digital assets are no longer considered optional but are becoming essential for maintaining competitiveness in financial services.
Seven out of 10 finance leaders now believe that offering digital asset solutions is necessary to remain relevant. Among these, stablecoins, digital tokens pegged to fiat currencies, have emerged as a key use case. These instruments help improve cash flow efficiency by enabling faster and more predictable transactions, effectively allowing businesses to manage their capital more efficiently.
Adoption trends also show clear segmentation across the financial sector. Fintech firms are leading implementation, particularly in payments and treasury operations, while banks and asset managers are focusing more on infrastructure such as custody and tokenisation. This reflects a broader industry shift where traditional institutions are building the foundational systems needed to support digital finance.
Security remains a central concern, with nearly all respondents highlighting the importance of certifications and operational resilience. This underscores that while adoption is accelerating, trust and regulatory compliance will play a decisive role in shaping the long-term trajectory of digital assets.
These developments point to a dual transformation in global markets. On one hand, geopolitical tensions and inflation are reinforcing a higher-for-longer interest rate environment, challenging traditional safe-haven assets like gold. On the other, digital assets are steadily integrating into the financial system, offering new tools for efficiency, liquidity, and value transfer.
News From the Cryptosphere
MARA Executes $1.1B Bitcoin Liquidation to Deleverage Balance Sheet and Accelerate Strategic Pivot
MARA Holdings’ latest press release marks a decisive shift in its corporate crypto treasury strategy, as the firm moves from aggressive Bitcoin accumulation toward active balance sheet optimization and strategic redeployment of capital.
Between March 4 and March 25, 2026, MARA sold 15,133 BTC for approximately $1.1 billion, using the majority of proceeds to repurchase roughly $1.0 billion of its zeropercent convertible senior notes due 2030 and 2031. This represents one of the largest single Bitcoin liquidations by a publicly traded miner and signals a clear departure from its prior “HODL-centric” treasury model.
The debt repurchase was executed at an approximate 9 percent discount to par value, allowing MARA to capture about $88 million in economic value while reducing its convertible debt burden by roughly 30 percent. Post-transaction, total convertible indebtedness declines from about $3.3 billion to $2.3 billion, significantly improving leverage metrics and reducing potential shareholder dilution from future conversions.
Strategically, this move reflects a capital allocation pivot. Rather than maximising Bitcoin exposure, MARA is now optimizing its capital structure to enhance financial flexibility and optionality. Management explicitly framed the transaction as a way to “de-lever on its own terms,” using Bitcoin not just as a store of value, but as a liquid reserve asset for corporate restructuring.
Equally important is the broader business transformation underpinning this decision. The company is actively expanding beyond pure Bitcoin mining into AI and high-performance computing (HPC) infrastructure, where energy-intensive data centre capabilities can be repurposed for more stable and scalable revenue streams.
From a market structure perspective, MARA’s actions highlight an emerging divergence among institutional Bitcoin holders. While firms like Strategy continue aggressive accumulation, MARA is demonstrating a hybrid treasury model, treating Bitcoin as both a strategic asset and a balance sheet tool.
Ultimately, this announcement represents more than a debt transaction: it signals a maturation of corporate crypto strategy, where digital assets are actively managed to optimise capital efficiency, reduce risk, and fund next-generation infrastructure expansion.
FTC Launches Innovation Task Force to Shape the Future of Crypto, AI, and Prediction Markets
The US Commodity Futures Trading Commission (CFTC) has established a new Innovation Task Force, signalling a decisive shift toward proactively shaping the regulatory architecture of emerging financial technologies, particularly crypto assets, artificial intelligence, and prediction markets.
At its core, the initiative is designed to address a growing mismatch between rapid product innovation and outdated regulatory frameworks. As digital assets, AI-driven trading systems, and event-based derivatives evolve at an accelerated pace, the CFTC aims to develop tailored oversight models that can accommodate innovation without compromising market integrity.
A central objective of the task force is to formalise engagement between regulators and builders. By creating a structured interface for developers, exchanges, and financial institutions, the CFTC is attempting to move away from reactive enforcement toward collaborative rulemaking. This reflects a broader institutional ambition: positioning the United States as a leader in what regulators increasingly describe as the “future of finance.”
The inclusion of prediction markets is particularly significant. These platforms, where users trade contracts based on real-world outcomes, have become a focal point of regulatory tension, sitting at the intersection of derivatives law and gambling regulation. The CFTC has consistently asserted its jurisdiction over such markets, even as individual States challenge their legality.
Meanwhile, AI integration introduces a new layer of complexity. From algorithmic trading to predictive analytics, AI is reshaping how financial markets operate, raising questions around transparency, bias, and systemic risk. By incorporating AI into the task force’s mandate, the CFTC acknowledges that future market oversight will require technological fluency, not just legal authority.
Strategically, this move represents a pivot from fragmented policymaking toward a unified regulatory framework spanning multiple frontier technologies. It also aligns with broader political and legislative momentum, as lawmakers simultaneously push to define the boundaries of prediction markets and crypto finance.
Ultimately, the task force is less about immediate rule changes and more about institutional positioning: ensuring that regulators, not just innovators, help define the next generation of global financial infrastructure.
NYSE and Securitize Launch Ambitious 24/7 Tokenised Securities Platform
The New York Stock Exchange (NYSE), owned by Intercontinental Exchange, has partnered with Securitize to develop a next-generation trading venue for tokenised securities, marking one of the most consequential steps yet in the convergence of traditional finance and blockchain infrastructure.
At the centre of the initiative is a proposed Digital Trading Platform that would enable 24/7 trading of stocks and ETFs as blockchain-based tokens, alongside instant settlement, a stark departure from the current T+1 settlement cycle and limited market hours. The platform is designed to allow assets to be issued directly on-chain, with Securitize acting as NYSE’s first digital transfer agent, responsible for maintaining ownership records, issuing tokenised shares, and managing corporate actions such as dividends.
A critical innovation lies in the re-architecture of market infrastructure. Unlike competing approaches such as those being explored by Nasdaq, which integrate tokenisation into existing systems, NYSE’s model may bypass traditional clearinghouses like the DTCC, enabling direct blockchain-based settlement. This introduces the possibility of disintermediating key legacy functions, compressing settlement risk, and unlocking continuous global liquidity.
Equally significant is the emphasis on “true tokenisation”, rather than synthetic exposure. The platform aims to represent actual equity ownership on-chain, preserving shareholder rights such as voting and dividends, addressing a major limitation of earlier tokenised products that functioned more like derivatives.
From a strategic standpoint, this move reflects intensifying competition among major exchanges to define the architecture of on-chain capital markets. Tokenisation promises enhanced efficiency, fractional ownership, and global accessibility, but also raises unresolved challenges around regulation, custody, and liquidity.
Ultimately, the NYSE–Securitize partnership signals a potential paradigm shift: if successfully implemented and approved by regulators, it could transform equities from time-bound, intermediated instruments into programmable, continuously traded digital assets, redefining how capital markets operate at a structural level.